03. Reveal
Reveal is a business intelligence solution that is purpose-built for embedded analytics. Deliver full-featured self-service dashboards and modern reporting with a beautiful, branded experience in any JavaScript framework, Windows Forms, or WPF application. Deploy to any public or private cloud or your own on-prem servers.
01. Branding
*
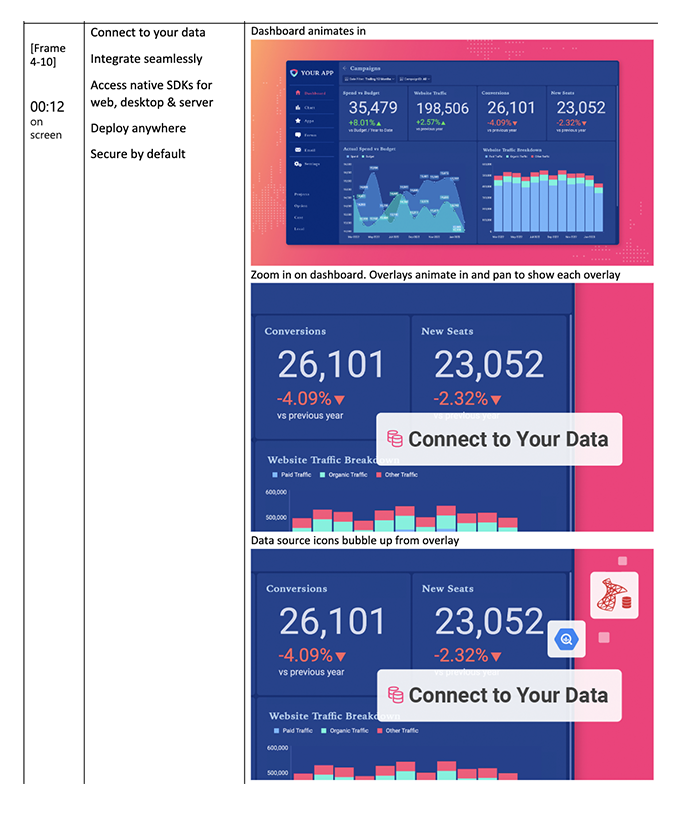
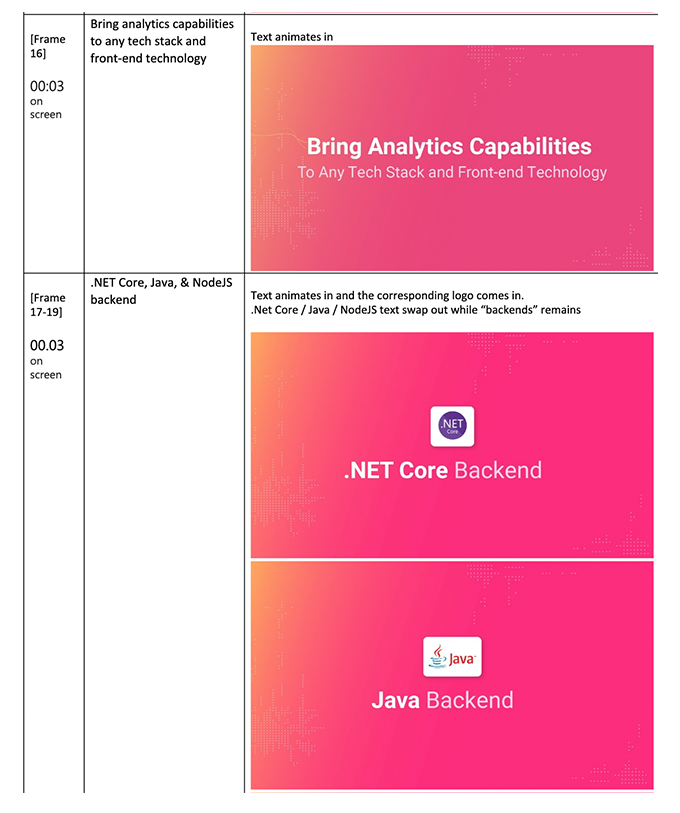
02. Motion
*
03. Website
*
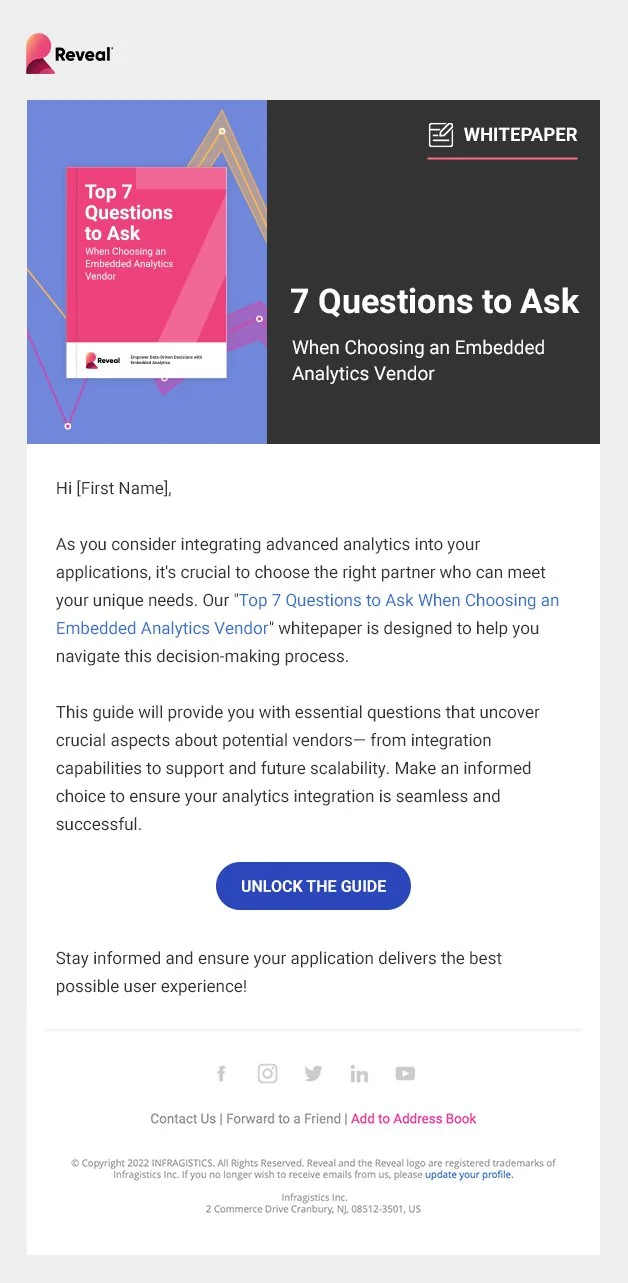
04. Email
*
05. Social
*
01. Branding * 02. Motion * 03. Website * 04. Email * 05. Social *
01. Branding

This is a description about the imagery above.


02. Motion

This is a description about the imagery above.


03. Website
04. Email

05. Social


Latest Work
01. New UX Project
Website Design. UX/UI Design. Branding.
02. New UX Project
Website Design. UX/UI Design. Branding.
Branding. Website Design. Video Production.
Branding. Website Design. Social Design.